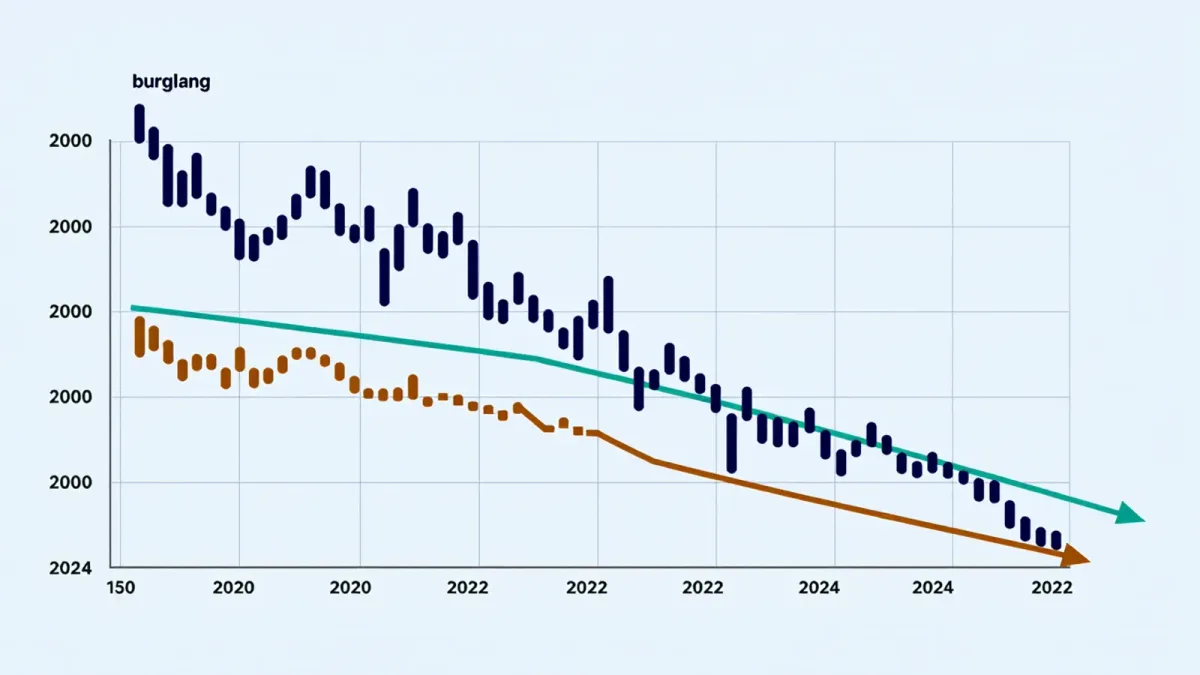
NIBRS, the FBI's National Incident-Based Reporting System, shows property crime falling through the mid-2020s after a sharp motor-vehicle-theft spike in 2022 and 2023: per FBI published data, burglary and larceny declined steadily for two decades, while vehicle thefts rose roughly 10 percent in 2022 and another 12 percent in 2023 before easing in 2024. The richer incident-level records explain the pattern better than the old summary counts ever could.
Every claim below is drawn from published federal data and named analyses; this site publishes information, not legal advice.
What changed when the FBI switched to NIBRS?
Until 2020, most agencies reported crime through the Summary Reporting System, which counted a handful of offense categories and, for most crimes, only the single most serious offense per incident. On January 1, 2021, the FBI retired that system and made NIBRS the only accepted format. NIBRS records each incident with details the summary system never captured: every distinct offense in an incident, victim and offender relationships, property type and value, time of day, location type, and whether the offense was attempted or completed.
The transition was not consistent for the data series, and agencies knew it — more than half of state and local agencies were still not submitting NIBRS when the deadline passed. The FBI accepted partially transitioned data in 2021 with caveats rather than estimates, which means the 2021 national numbers rest on an incomplete base and are not cleanly comparable to earlier years.
What do the richer records show about burglary?
Burglary has been in a long decline that NIBRS records confirm at the incident level. Per FBI published data, the burglary rate fell by more than half between the early 2000s and the early 2020s, and NIBRS detail shows where the decline concentrates: offenses at residences, particularly entries attempted without force. The detail also shows a large share of attempted burglaries — incidents where someone tried and failed to enter — that the summary system folded invisibly into totals.
Researchers reading NIBRS attribute part of the decline to security improvements: alarm systems, doorbell cameras, and the falling resale value of consumer electronics that are now cloud-locked and traceable. Those explanations come from criminology literature, not from the FBI file itself, and they remain arguments rather than findings.
What happened to motor vehicle theft?
Motor vehicle theft is the clearest case where NIBRS-style incident detail changed the picture. After decades of decline, thefts rose sharply starting in 2022, per FBI published data — an increase analysts tied partly to a documented vulnerability in certain Kia and Hyundai models built without electronic immobilizers, which insurers and the Highway Loss Data Institute documented with claims data. NIBRS records show the rise concentrated in completed thefts of older-model vehicles, at night, in and around metropolitan areas, which fits the targeting pattern the insurance data described.
By 2024 the same records showed the spike receding as manufacturers shipped anti-theft software updates and owners installed steering-column locks. The lesson for readers is methodological: a national theft trend can be a specific, named, mechanical story, and only offense-level data with property and timing detail can show that.
Related stories: How seasonal patterns show up in crime data, and which ones hold · Why single-cause explanations of the crime drop rarely survive scrutiny.
Why can't readers compare 2019 to 2021 directly?
Because the denominators changed. In 2021, major agencies including some of the largest in the country had not finished converting to NIBRS, so the national property crime total covered a different slice of the country than 2020 or 2022. Per the FBI's own technical notes, 2021 estimates published later used statistical imputation to approximate national totals, but the underlying submissions were incomplete, and comparisons spanning 2020 to 2021 carry a documented break.
From 2022 onward, coverage improved substantially, and 2023 was the first year in which a large majority of agencies submitted NIBRS data. Careful analysts therefore treat 2022 through 2024 as the usable NIBRS baseline and avoid arithmetic that reaches across the 2021 gap.
What does NIBRS show that summary counts never did?
Three things matter most for property crime. First, clearance: NIBRS ties cleared status to each offense within an incident, so readers can see that one arrest often closes several recorded thefts at once. Second, location: the records distinguish thefts at parking facilities, residences, convenience stores, and transit, which shows where prevention resources actually intersect the offense. Third, value: recorded loss amounts let analysts separate high-volume, low-value shoplifting incidents from the smaller number of large-value thefts that dominate dollar losses.
- Every offense in an incident is recorded, not just the most serious one.
- Victim-offender relationship and time of day are captured by default.
- Property loss type and value are recorded per offense.
- Clearance status attaches to each offense individually.
Who participates, and how complete is the picture?
Participation is now the binding constraint on every national claim. Per the FBI's published participation tables, roughly 85 percent of agencies reported NIBRS data for 2023, but the missing share is not random — several large states and some major cities were absent or partial in earlier transition years, and a state with a single non-reporting large department shows a visible hole in the national map. Analysts at the Council on Criminal Justice and academic research centers routinely reweight or restrict samples for this reason, and their published estimates can differ from raw FBI tables for that reason alone.
Readers should therefore treat any national property crime figure as an estimate with a documented coverage base, and check two numbers before quoting it: the share of agencies reporting, and whether the figure comes from raw submissions or from the FBI's imputed national estimates. Both are published alongside the data.
How should readers use NIBRS trend lines now?
Use the years 2022 through 2024 as the comparable core, check each figure against the FBI's participation tables before quoting it, and prefer incident-level detail over national totals. Per FBI published data, the property picture through 2024 is of a burglary decline that never reversed, larceny near historic lows, and a vehicle-theft spike that rose and began to recede within about three years. A system that counts every stolen phone and every failed break-in tells a more precise story than the summary ever did — provided readers remember exactly when the counting changed.
For more context, read How seasonal patterns show up in crime data, and which ones hold.
For more context, read clearance rate.
For more context, read crime drop.